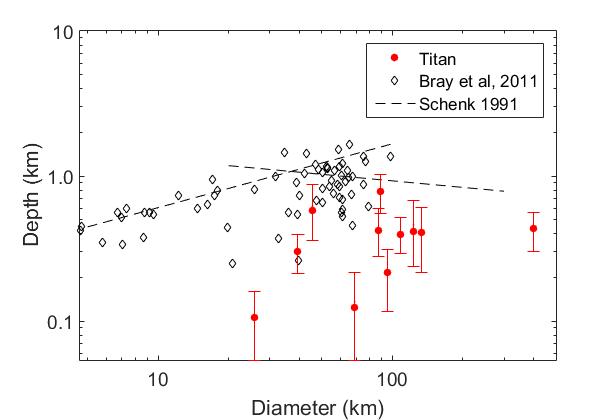
So, last time I forgot to talk about all the time I spent over the break working to update the depth to diameter plot for Titan’s craters. This entailed finding the craters that had adequate data then interpreting it. The hard part was needing to go back to the start to extract all the data again because I had not saved error data. Unfortunately, this proved rather difficult to do remotely but I manged to figure it out.

These last couple weeks I’ve spent finishing up my list of craters. Or maybe that’s not a great way to put it. I went through and I found each crater and matched it with the previous crater list. Now, this entailed reanalyzing craters by deleting, resizing, and in some cases adding to the total map. In total, there are a 111 craters including all of my craters and those on the list already, but 13 I’d consider 13 of those as not craters. Needless to say, this process was tedious, especially since GIS doesn’t recognize the projection properly.
After that, I had to identify which swaths (stretches of images) are available for each crater. My computer is not equipped at handling large amounts of files in GIS. So after several failed attempts of making it work, I ended up using 32ppd projections (compared to 128 mosaic res). Except, I had to insert them one at a time, and study them mostly individually. In the process, I noted which craters it covered. I made note of each one that covered it and I marked coverage in 64ppd (lowest used) with a star*. I also rated each swath on a scale from 1 to 10 (bad to good) for the quality of each imager because not every swath turns out as a well as others (even on the same resolution). Now, this may sound easy, but made I felt like I was going bad doing one, after the other, after the other. I then converted these numbers to letters A through J, and to prevent the lowest resolution swaths from overlying decent quality higher resolution swaths, I labeled them such that the highest quality 64ppd swaths would only make it on top of a given layer of 128ppd (~5/10).

The result is mostly the same, with some changes. One big change is that one image moves for the north middle to south west (not sure what did this), and some high quality swaths overlap other good swaths that don’t blend as well. But its not as if I can import thse into photoshop and overlay them individually (I mean I can but thats not viable).
The ordering took a long time, but so did mosaiking, but while it was going I worked to update the code. Now each crater gets its exact name (in the existing crater list) and lists its diameter in the literature and that I found. Then it plots each. If SARtopo data is available it is used and the plot uses red dashed lines instead of red lines.
As I right this, the only thing I haven’t achieved yet is that I want to get my code to plot the 13 craters I didn’t plot to see what they look like so I can compare those to previous literature. Hopefully, I will have that ready for my meeting with Catherine tomorrow 🙂 . I am also finding that may images have black regions, where the data is saturated out for some reason. I suspect this is a problem with my code because its having trouble processing such a large image and instead messes up in places. I don’t think I’ll be able to fix this in time, much to my chagrin.

note any final issues, but mostly see how they’ve changed and how they map in ISS. The reason we see these black spots in the first 4 images is because, even though they include different base resolutions, the project resolution (128ppd) is the same.
One glaring issue with the ISS data is that they rarely match up. I don’t know if I’ve got the wrong coordinates for the ISS (assuming the extent is -90 to 90 in y and 360 to 0 in x).For now, that’s all I’ve got with the possibility of updates before meeting.
UPDATE: Black spots have been removed. I recycle codes and sometimes things get left in. Other times, I do things that seem to make sense then seem like nonsense later on. Either way, it was a problem where I was zeroing out the highest (brightest) points.
